IBF: POSI-TV-ITY
A Research Study Visualized
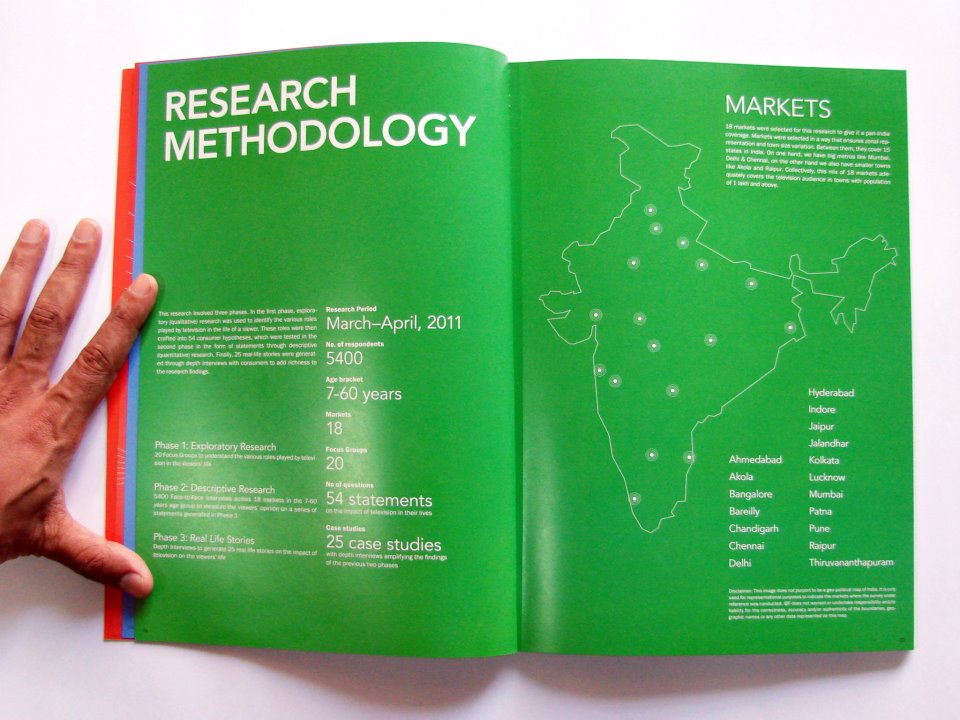
Indian Broadcasting Foundation (IBF), the apex organization on television broadcasting in India, had conducted a research on impact of television on people’s life. Done across 18 cities in India and with over 5000 participants, the task was to find a narrative out of the findings and visualize the quantitative information collected on viewer’s response.
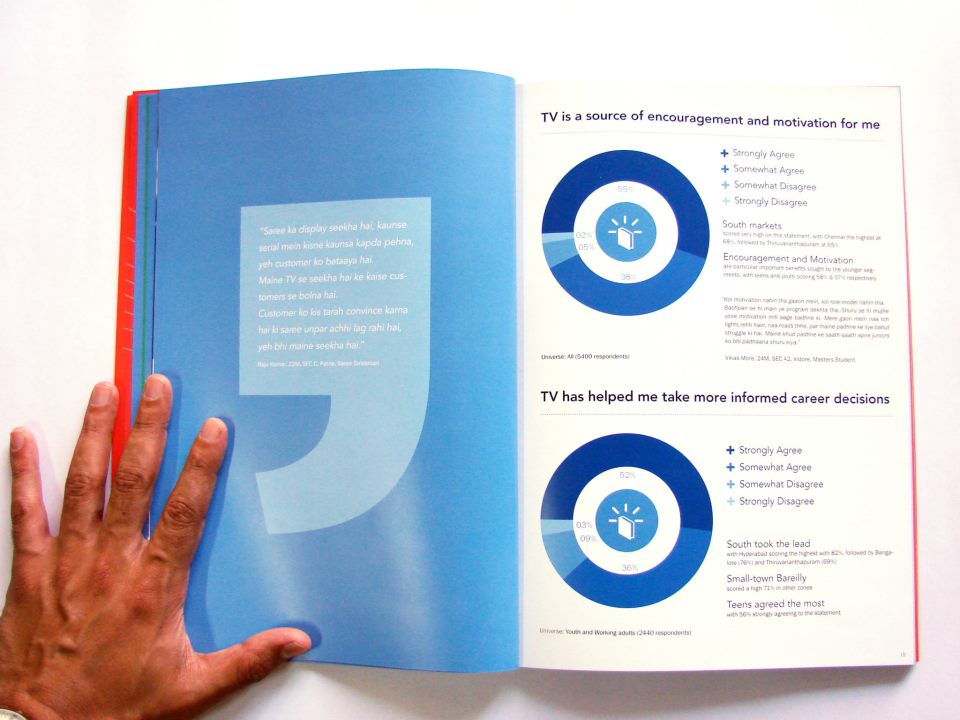
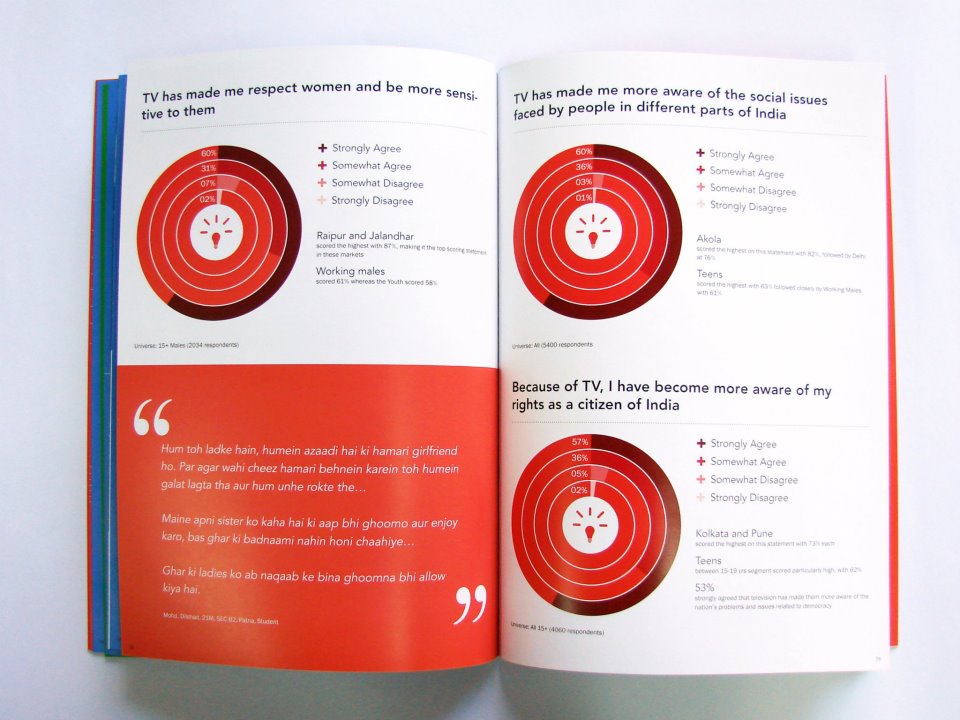
Being a purely communication design exercise, the approach was to visually represent the key information points and highlight the positive impact television had on the viewers. Intended to influence policy-makers and industry heads, the report was structured as an easy read and a data reference guide at the same time highlighting real life quotes and remarks from the viewers.